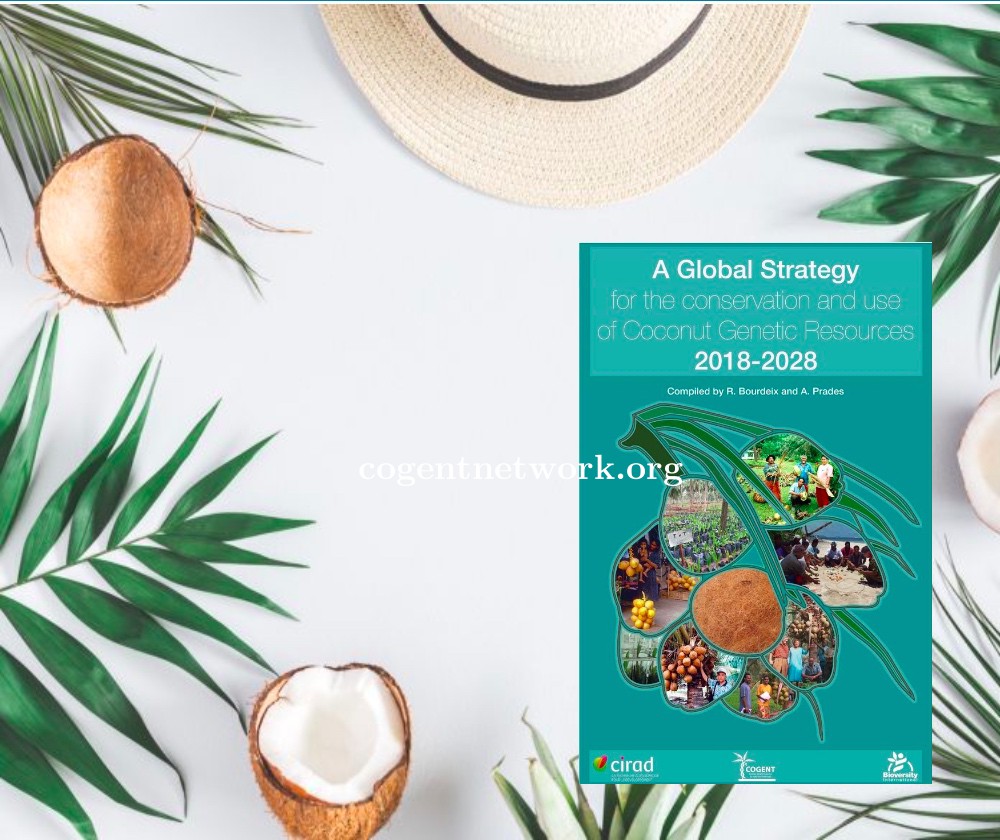
This Global Strategy for Conservation and Use of Coconut Genetic Resources has been compiled by Dr Roland Bourdeix and Dr Alexia Prades of CIRAD, (formal launch at the APCC 48th COCOTECH meeting in Bangkok 20-24 August 2018). An implementation plan will be discussed at a COGENT side-meeting 25-26 August. COGENT embraces 39 coconut-producing member-countries, representing more than 98% global production. COGENT aims to strengthen international collaboration in conservation and use of coconut genetic resources; promote improving coconut production, and boost linked livelihoods.
This Strategy is the product of consulting with more than 90 key-experts receiving more than 400 contributions over seven years. It has been supported by Bioversity International, CIRAD, the CGIAR research program Forests, Trees and Agroforestry (FTA), and ACIAR/DFAT, and aims to support optimizing the conservation and use of as much representative diversity as possible.
It is hoped that, as an evolving document, this Strategy will provide the benchmark for effectively implementing the comprehensive conservation and research agenda proposed by the international coconut research community, as a route to the enhanced wellbeing of the millions of coconut smallholders across the globe.
Quoting Prof Gabrielle Persley (ACIAR Commissioner) in her Strategy foreword, “ coconut is indeed the “Tree of Life”. More than 100 million people living in fragile coastal areas … depend on coconut for their livelihoods. Coconut provides food and water, timber and leaves to build homes, and oil and copra for fuel and as a source of income. In times of environmental disasters, such as cyclones and tsunamis, coconut is often the last tree standing, able to protect and sustain communities in the immediate aftermath of the disaster, providing food, water and shelter while people rebuild their lives. Globally, the demand for coconut products is growing exponentially. The estimated global market for coconut water alone is predicted to be in the order of USD 10 billion by 2030. This growing export market for a wider range and higher value of coconut products offers new opportunities for increasing incomes for millions of small-scale coconut producers…. At a time when the demand for coconut and coconut products is growing worldwide, it is important to conserve and utilize the rich biological diversity of the crop. It is timely now for Bioversity/COGENT to be launching a new Global Strategy for Coconut Genetic Resources for the next ten years and beyond. It is also pleasing to learn that the Asia-Pacific Coconut Community (APCC) will be joining with Bioversity, the Pacific Community (SPC), the Global Crop Diversity Trust, ACIAR and the Australian Department of Foreign Affairs and Trade (DFAT) in support for this new strategy and its implementation through COGENT and its partners across the coconut producing world.
Not available
A. GENERAL INFORMATION
1. Capital : Suva
2. Total Area (Sq. Km) : 18,720
3. Population* : 877,459
4. Gross Domestic Product (Million US$) : 5,270
5. Currency Unit : Fiji Dollar
6. Exchange rate to 1 US$ (Average) : 2.07
B. COCONUT INDUSTRY
1. Area Under Coconut (Ha) : 63,885
2. Total Coconut Production
2.1 In Million Nuts Equivalent : 159
2.2 In Copra Equivalent (MT) : 27,000
3. Estimated Domestic Consumption
3.1 In Million Nuts Equivalent : n.a.
3.2 In Copra Equivalent (MT) : n.a.
4. Exports Volume (MT)
4.1 Coconuts : 28
4.2 Coconut Oil : 1,955
4.3 Copra Meal : 28
4.4 Coconut Shell Charcoal : 4
4.5 Desiccated Coconut : 1
4.6 Other : 29
5. Coconut Export Value (‘000 US$) : 5,261
6. Total Export Revenue (Million US$) : 956
7. Percentage Contribution to National
Export Earnings (%) : 0.55
Guyana, a country on South America’s North Atlantic coast, is defined by its dense rainforest. English-speaking, with cricket and calypso music, it's culturally connected to the Caribbean region. Its capital, Georgetown, is known for British colonial architecture, including tall, painted-timber St. George’s Anglican Cathedral. A large clock marks the facade of Stabroek Market, a source of local produce.
Details to be advised --
Source : Google
A. GENERAL INFORMATION
1. Capital : New Delhi
2. Total Area (Sq. Km – Million) : 3.288
3. Population (Million) : 1,210
4. Gross Domestic Product (Rs. Core) : 104,728 (at Factor Cost-current price)
(2013-2014 estimate)
5. Currency Unit : Indian Rupee (INR)
6. Exchange rate to 1 US$ (Average 2014) : 61.03
B. COCONUT INDUSTRY
1. Area Under Coconut (Million Ha) : 2.14
2. Total Coconut Production
2.1 In Million Nuts Equivalent : 21,665
2.2 In Copra Equivalent (Million MT) : 3.10
3. Estimated Domestic Consumption
3.1 In Million Nuts Equivalent : 21,158
3.2 In Copra Equivalent (Million MT) : 3.02
4. Export Volume (MT) (2013-2014)
4.1 Coconuts : 52,720
4.2 Copra : 11,957
4.3 Coconut Oil : 7,067
4.4 Copra Meal : 37
4.5 Desiccated Coconut : 5,166
4.6 Coir Yarn : 4,187
4.7 Coir Mattings : 3,425
4.8 Coir Mats : 22,843
4.9 Rugs & Carpets : 93
4.10 Coir Rope : 498
4.11 Rubberized Coir : 965
4.12 Tufted Mat : 43,752
4.13 Coco Pith : 271,495
4.14 Coir Fibre : 173,902
4.15 Curled Coir : 11,263
4.16 Other Coir Products : 4,557
4.17 Coconut Shell Charcoal : 24,773
4.18 Coconut Shell Based Activated Carbon : 96,561
5. Coconut Export Value (Million Rs.) : 26,322
(Million US$) 431
6. Total Export Value (Million US$) : 3,079
7. Percentage Contribution to National Export Earnings (%) : 0.14
*Decrease in the export $ value compared to previous year (2012) is due to the increase in the Exchange rate
A. GENERAL INFORMATION
1. Capital : Jakarta
2. Total Area (Sq. Km) : 1,904,569
3. Population (Million) : 264.6
4. Gross Domestic Product (US$ Billion) : 1,015.42
5. Currency Unit : Rupiah (Rp)
6. Exchange rate to 1 US$ (Average) : 13,381
B. COCONUT INDUSTRY
1. Area Under Coconut (Million Ha) : 3.54
2. Total Coconut Production
2.1 In Million Nuts Equivalent : 14,356
2.2 In Copra Equivalent (Million MT) : 2.87
3. Estimated Domestic Consumption
3.1 In Nuts Equivalent (000 MT) : 8,376
3.2 In Copra Equivalent (000 MT) : 1,675
4. Number of Coconut Farmers (000 Household) (2017) : 6,517
5. Export Volume (MT)
4.1 Fresh Coconuts Mature Nuts : 903,862
4.2 Copra : 24,425
4.3 Coconut Oil : 510,441
4.4 Copra Meal : 202,090
4.5 Desiccated Coconut : 98,038
4.6 Coconut Milk/Cream/Powder : 27,696
4.7 Shell Charcoal : 311,270
4.8 Activated Carbon : 20,076
4.9 Fibre & Fibre Products : 31,136
6. Coconut Export Value (US$ Million) : 1,487
7. Total Export Revenue (US$ Million) : 168,775
8. Percentage Contribution to National Export Earnings (%) : 0.88
A. GENERAL INFORMATION
1. Capital : Kingston
2. Total Area (Sq. Km) : 10,991
3. Population (Million) : 2.721
4. Gross Domestic Product (US$ billion) : 13.89
5. Currency Unit : Jamaican Dollar
6. Exchange rate to 1 US$ : 111
B. COCONUT INDUSTRY
1. Area Under Coconut ('000 Ha) : 15.9
2. Total Coconut Production
2.1 In Million Nuts Equivalent : 98.5
2.2 In Copra Equivalent ('000 MT) : 16.4
3. Estimated Domestic Consumption
3.1 In Million Nuts Equivalent : 97,4
3.2 In Copra Equivalent (Million MT) : 0.016
4. Export Volume (MT)
4.1 Coconuts : 77
4.2 Coconut Oil : 4.3
4.3 Coconut Shell Charcoal : 0.8
4.4 Others -
5. Coconut Export Value ('000 US$) : 236.3
6. Total Export Revenue ('000 US$) : 1,455,000
7. Percentage Contribution to National Export Earnings (%) : 0.02
A. GENERAL INFORMATION
1. Capital : Nairobi
2. Total Area (Sq. Km) : 580,000
3. Population (Million) : 45.55
4. Gross Domestic Product (US$ Billion) : 60.94
5. Currency Unit : Shilling
6. Exchange rate to 1 US$ : 90.47
B. COCONUT INDUSTRY
1. Area Under Coconut (‘000 Ha) : 177
2. Total Coconut Production
2.1 In Million Nuts Equivalent : 259
2.2 In Copra Equivalent ('000 MT) : 19.9
3. Estimated Domestic Consumption
3.1 In Million Nuts Equivalent : 110
3.2 In Copra Equivalent (MT) : 1,404
4. Export Volume (MT)
4.1 Copra : N.A.
4.2 Coconut Oil : 27.23
4.3 Copra Cake : N.A.
5. Coconut Export Value (US$) : 1,270,255
6. Total Export Revenue (US$ ‘000) : 454,924
7. Percentage Contribution to National Export Earnings (%) : 0.28
A. GENERAL INFORMATION
1. Capital : Tarawa
2. Total Area (Sq. Km) : 726.34
3. Population : 112,334
4. Gross Domestic Product (US$ million) : 166.8
5. Currency Unit : Australian $
6. Exchange rate to 1 US$ (Average) : 1.11
B. COCONUT INDUSTRY
1. Area Under Coconut (Ha) : 19,852
2. Total Coconut Production
2.1 In Million Nuts Equivalent : 54.6
2.2 In Copra Equivalent (MT) : 9,134
3. Estimated Domestic Consumption
3.1 In Million Nuts Equivalent : N.A.
3.2 In Copra Equivalent (MT) : N.A.
4. Export Volume
4.1 Coconut Oil (MT) : 2,939
4.2 Copra (MT) : 1,332
4.3 Copra Meal (MT) : 216
5. Coconut Export Value (US$ ‘000) : 4,516
6. Total Export Revenue (US$ ‘000) : 9,764
7. Percentage Contribution to National Export Earnings (%) : 46.3
A. GENERAL INFORMATION
1. Capital : Kuala Lumpur
2. Total Area (Sq. Km) : 330,396
3. Population (Million) : 31.58
4. Gross Domestic Product (US$ Billion) : 354.29
5. Currency Unit : Ringgit Malaysia
6. Exchange rate to 1 US$ (Average) : 4.035
B. COCONUT INDUSTRY
1. Area Under Coconut (Ha) : 87,550
2. Total Coconut Production
2.1 In Million Nuts Equivalent : 653
2.2 In Copra Equivalent (MT) : 130,698
3. Estimated Domestic Consumption
3.1 In Million Nuts Equivalent : N.A.
3.2 In Copra Equivalent (MT) : N.A.
4. Export Volume (MT)
4.1 Fresh Coconuts : 48,247
4.2 Copra : 684
4.3 Coconut Oil : 187,665
4.4 Copra Meal : 2,206
4.5 Desiccated Coconut : 9,800
4.6 Coconut Milk Powder : 3,575
4.7 Activated Carbon : 15,197
4.8 Fibre & Fibre Products (Coir Fibre) : 11,877
4.9 Other Non – Traditional Products Export Like : N.A.
VCO, Coconut Water, etc.
5. Coconut Export Value (Million US$ ) : 2,037
6. Total Export Revenue (Million US$) : 2,681,452
7. Percentage Contribution to National Export Earnings (%) : 0.08
A. GENERAL INFORMATION
1. Capital : Majuro
2. Total Area (Sq. Km) : 181.3
3. Population : 58,898
4. Gross Domestic Product (US$ Million) : 204
5. Currency Unit : US$
6. Exchange rate to 1 US$ (Average) : 1
B. COCONUT INDUSTRY
1. Area Under Coconut (Ha) : 7,624
2. Total Coconut Production
2.1 In Million Nuts Equivalent : 35
2.2 In Copra Equivalent (MT) : 5,000
3. Estimated Domestic Consumption
3.1 In Million Nuts Equivalent : N.A.
3.2 In Copra Equivalent (MT) : N.A.
4. Export Volume (MT)
4.1 Copra : -
4.2 Coconut Oil : 124
4.3 Coconut Cake : 482
5. Coconut Export (US$ ‘000 ) : 369
6. Total Export Value (US$ ‘000) : 861,720
7. Percentage Contribution to National Export Earnings (%) : 0.04
A. GENERAL INFORMATION
1. Capital : Palikir
2. Total Area (Sq. Km) : 702
3. Population : 102,116
4. Gross Domestic Product (US$ Million, 2013) : 318.071
5. Currency Unit : US Dollar
6. Exchange rate to 1 US$ (Average) : 1
B. COCONUT INDUSTRY
1. Area Under Coconut (Ha) : 18,252
2. Total Coconut Production
2.1 In Million Nuts Equivalent : 59
2.2 In Copra Equivalent (MT) : 7,373
3. Estimated Domestic Consumption
3.1 In Nuts Equivalent : N.A.
3.2 In Copra Equivalent : N.A.
4. Export Volume (MT)
4.1 Copra : 76
4.2 Coconut Oil : -
4.3 Other Non – Traditional Coconut Products export : N.A.
Like VCO, Coconut Water, etc.
5. Coconut Export Value (US$) : 26,556
6. Total Export Revenue (US$) : 34,675
7. Percentage Contribution to National Export Earnings (%) : N.A.
A. GENERAL INFORMATION
1. Capital : Honiara
2. Total Area(Sq. km) : 452,860
3. Population (million) : 8.606
4. Gross Domestic Product (US$ billion) : 23.077
5. Currency Unit : Bokolo Dollars
6. Exchange rate to 1 US$ : 3.279
B. COCONUT INDUSTRY
1. Area Under Coconut (1000 Ha) : 38
2. Total Coconut Production
2.1 In Million Nuts Equivalent : 100
2.2 In Copra Equivalent (MT) : 20,126
3. Estimated Domestic Consumption
3.1 In Million Nuts Equivalent : N.A.
3.2 In Copra Equivalent (Million MT) : N.A.
4. Exports Volume
4.1 Copra (MT) : 15,856
4.2 Coconut Oil (MT) : N.A.
5. Coconut Export Value (US$ '000) : 9,774
6. Total Export Revenue (US$ '000) : 439,871
7. Percentage Contribution to National
Export Earnings (%) : 2.22
A. GENERAL INFORMATION
1. Capital : Manila
2. Total Area (s.q. km) : 300,000
3. Population (Million) : 106.651
4. Gross Domestic Product (USD billion) : 330.481
5. Currency Unit : Peso
6. Exchange rate to 1 US$ (Average, 2013) : 52.661
B. COCONUT SECTOR
1. Area Under Coconut (Million Ha) : 3.50
2. Total Coconut Production
2.1 In Million Nuts Equivalent : 14,696
2.2 In Copra Equivalent (Million MT) : 2.217
3. Estimated Domestic Consumption
3.1 In Million Nuts Equivalent : 5,084
3.2 In Copra Equivalent (Million MT) : 0.77
4. Exports Volume (MT)
4.1 Fresh Coconuts : 2,474
4.2 Copra : 554
4.3 Coconut Oil : 907,606
4.4 Copra Meal : 551,198
4.5 Desiccated Coconut : 109,099
4.6 Coco Coir (Baled Coir, Twine, Pads) : 24,619
4.7 Coconut Acid Oil : 6,772
4.8 Coco Fiber Waste (Coco Peat/Dust) : 3,215
4.9 Shell Charcoal : 72,097
4.10 Activated Carbon : 61,304
4.11 Coconut Milk (Liquid) : 1,390
4.12 Coconut Milk (Powder) : 863
4.13 Makapuno : 54
4.14 Coconut Water (Liter) : 24,905,917
4.15 Others (Glycerin, Alkanolamide, Grated : 75,231
Coconut Meat, Nata de Coco, Frozen Coco Meat, Coco Chips, Bukayo, Coco Jam, Coco Flour, Coco Vinegar, Coco Husk Cubes, Toilet/Bath Soap, Soap Chips, Laundry Soap, Shampoo, Virgin Coconut Oil, Coco Shell Powder, Hydrogenated CNO)
5. Coconut Export Value (US$ Million) : 1,828
6. Total Export Revenue (US$ Million) : 50,913
7. Percentage Contribution to National : 3.59
Export Earnings (%)
A. GENERAL INFORMATION
1. Capital : Apia
2. Total Area (Sq. Km) : 2,830
3. Population : 196,000
4. Gross Domestic Product (US$ Million) : 884
5. Currency Unit : Tala
6. Exchange rate to 1 US$ (average) : 2.58
B. COCONUT INDUSTRY
1. Area Under Coconut (Ha) : 99,082
2. Total Coconut Production
2.1 In Million Nuts Equivalent : 267
2.2 In Copra Equivalent (MT) : 52,920
3. Estimated Domestic Consumption
3.1 In Million Nuts Equivalent : 250
3.2 In Copra Equivalent (MT) : 50.1
4. Export Volume (MT)
4.1 Fresh Coconut : 1,311
4.2 Copra (MT) : N.A.
4.2 Coconut Oil (MT) : 82
4.3 Copra Meal (MT) : 2,094
4.4 Coconut Cream (MT) : 100
4.5 Desiccated Coconut (MT) : 13
4.6 Drinking Nuts (Nos) : N.A.
4.7 Other Non - Traditional Coconut Products : N.A.
export like VCO. Coconut Water, etc.
5. Coconut Export Value (US$ '000) : 1,500
6. Total Export Revenue (US$ '000) : 32,196
7. Percentage Contribution to National Export Earnings (%) : 4.7
A. GENERAL INFORMATION
1. Capital : Honiara
2. Total Area(Sq. km) : 28,450
3. Population : 653,097
4. Gross Domestic Product (US$ Billion) : 1.294
5. Currency Unit : Bokolo Dollars
6. Exchange rate to 1 US$ : 7,953
B. COCONUT INDUSTRY
1. Area Under Coconut (Ha) : 38
2. Total Coconut Production
2.1 In Million Nuts Equivalent : 100
2.2 In Copra Equivalent (MT) : 20,126
3. Estimated Domestic Consumption
3.1 In Million Nuts Equivalent : N.A.
3.2 In Copra Equivalent (Million MT) : N.A.
4. Exports Volume
4.1 Copra (MT) : 15,856
4.2 Coconut Oil (MT) : N.A.
5. Coconut Export Value (US$ '000) : 9,774
6. Total Export Revenue (US$ '000) : 439,871
7. Percentage Contribution to National
Export Earnings (%) : 2.22
A. GENERAL INFORMATION
1. Capital : Colombo
2. Total Area (Sq. km) : 65,610
3. Population (Million) : 21.279
4. Gross Domestic Product (US$ Billion) : 88.484
5. Currency Unit : Sri Lankan Rupee (LKR)
6. Exchange rate to 1 US$ (Average) : 162.56
B. COCONUT INDUSTRY
1. Area Under Coconut ('000 Ha) : 440
2. Total Coconut Production
2.1 In Million Nuts Equivalent : 2,870
2.2 In Copra Equivalent (Million MT) : 0.549
3. Estimated Domestic Consumption
3.1 In Million Nuts Equivalent : 2,104
3.2 In Copra Equivalent (Million MT) : 0.402
4. Exports Volume (MT)
4.1 Coconuts ('000 Nuts) : 33,073
4.2 Copra : 4,776
4.3 Coconut Oil : 11,254
4.4 Copra Meal : 2,556
4.5 Desiccated Coconut : 51,132
4.6 Coconut Cream/Milk : 17,413
4.7 Coconut Milk Powder : 5,835
4.8 Shell Charcoal : 8,736
4.9 Activated Carbon : 37,230
4.10 Mattress Fibre : 36,320
4.11 Bristle Fibre : 16,409
4.12 Twisted Fibre : 74,744
4.13 Coir Yarn : 2,205
4.14 Coir Twine : 8,222
4.15 Coir Fibre Dust/Pith : 157,177
4.16 Husk Chip : 14,610
4.17 Coconut Shell Flour : 486
5. Coconut Export Value (US$ Million) : 558.21
6. Total Export Revenue (US$ Million) : 11,130
7. Percentage Contribution to National Export Earnings (%) : 5.015
A. GENERAL INFORMATION
1. Capital : Bangkok
2. Total Area (Ha) : 320,696,800
3. Population (Million) : 69.428
4. Gross Domestic Product (US$ Billion) : 504.4
5. Currency Unit : Baht
6. Exchange rate to 1 US$ (Average) : THB 32.3
B. COCONUT INDUSTRY
1. Area Under Coconut ('000 Ha) : 206
2. Total Coconut Production
2.1 In Million Nuts Equivalent : 1,001
2.2 In Copra Equivalent ('000 MT) : 219
3. Estimated Domestic Consumption
3.1 In Million Nuts Equivalent : 1,001
3.2 In Copra Equivalent ('000 MT) : 219
4. Export Volume (MT)
4.1 Coconut : 531
4.2 Copra : 339
4.3 Coconut Oil : 1,960
4.4 Copra Meal : 2.3
4.5 Desiccated Coconut : 3,780
4.6 Coconut Milk : 179,297
4.7 Activated Carbon : 8,829
4.8 Fibre & Fibre Products : 39,704
4.9 Coconut Shell : 2,752
5. Coconut Export Value (US$ Million) : 408
6. Total Export Value (US$ Million) : 188,421
7. Percentage Contribution to Export Earnings (%) : 0.22
A. GENERAL INFORMATION
1. Capital : Nukualofa
2. Total Area (Sq. Km) : 748
3. Population : 103,000
4. Gross Domestic Product (Million) : US$439
5. Currency Unit : TOP$
6. Exchange rate to 1 US$ (average) : 2.237
B. COCONUT INDUSTRY
1. Area Under Coconut (000 Ha) : 31.1
2. Total Coconut Production
2.1 In Nuts Equivalent (Milllion) : 75.1
2.2 In Copra Equivalent ('000 MT) : 15.7
3. Estimated Domestic Consumption
3.1 In Million Nuts Equivalent : 27.6
3.2 In Copra Equivalent (MT) : 5,520
4. Export Volume (MT)
4.1 Coconut : 1,592
4.2 Copra : -
4.3 Coconut Oil : -
4.4 Drinking Nuts : 152
4.5 Other Non - Traditional Coconut Products
export like VCO. Coconut Water, etc. : -
5. Coconut Export Value ('000 US$) : 634
6. Total Export Revenue ('000 US$) : 15,259
7. Percentage Contribution to National
Export Earnings (%) : 4.15
A. GENERAL INFORMATION
1. Capital : Port Vila
2. Total Area (Sq. Km) : 12,189
3. Population : 298,333 (est 2020)
4. Gross Domestic Product (US$ Million) : 870 (est 2017)
5. Currency Unit : Vatu (Vt)
6. Exchange rate to 1 US$ (average) : 97.07
B. COCONUT SECTOR
1. Area Under Coconut ('000 Ha) : 91.9
2. Total Coconut Production
2.1 In Million Nuts Equivalent : 415
2.2 In Copra Equivalent ('000 MT) : 79.2
3. Estimated Domestic Consumption
3.1 In Million Nuts Equivalent : N.A.
3.2 In Copra Equivalent (MT) : N.A.
4. Exports Volume (MT)
4.1 Copra : 25,194
4.2 Copra Meal : 4,786
4.3 Coconut Oil : 9,208
4.4 Desiccated Coconut : 0.1
5. Coconut Export Value (’000 USD) : 2,683
6. Total Export Revenue (’000 USD) : 6,100
7. Percentage Contribution to National Export Earnings (%) : 43.98
A. GENERAL INFORMATION
1. Capital : Hanoi
2. Total Area (Sq. Km) : 331,212
3. Population (Million) : 95.546
4. Gross Domestic Product (US$ Billion) : 244.498
5. Currency Unit : Vietnam Dong (VND)
6. Exchange rate to 1 US$ : 22,602
B. COCONUT SECTOR
1. Area Under Coconut (Ha) : 157,853
2. Total Coconut Production
2.1 In Million Nuts Equivalent : 1,246
2.2 In Copra Equivalent (MT) : 373,675
3. Estimated Domestic Consumption
3.1 In Million Nuts Equivalent : N.A.
3.2 In Copra Equivalent (MT) : N.A.
4. Exports Volume (MT)
4.1 Coconut : 69,548
4.2 Copra : 12,787
4.3 Coconut Oil : 991
4.4 Copra Meal : -
4.5 Desiccated Coconut : 40,302
4.6 Coir Yarn : -
4.7 Coir Mattings, Coir Mats : -
4.8 Rugs & Carpets : 446
4.9 Coir Rope : -
4.10 Coconut Shell Charcoal : 28,856
4.11 Activated Carbon : 14,513
5. Coconut Export Value (US$ Million) : 225
6. Total Export Revenue (US$ Million) : 150,475
7. Persentage Contribution To National Export Earnings (%) : 0.14