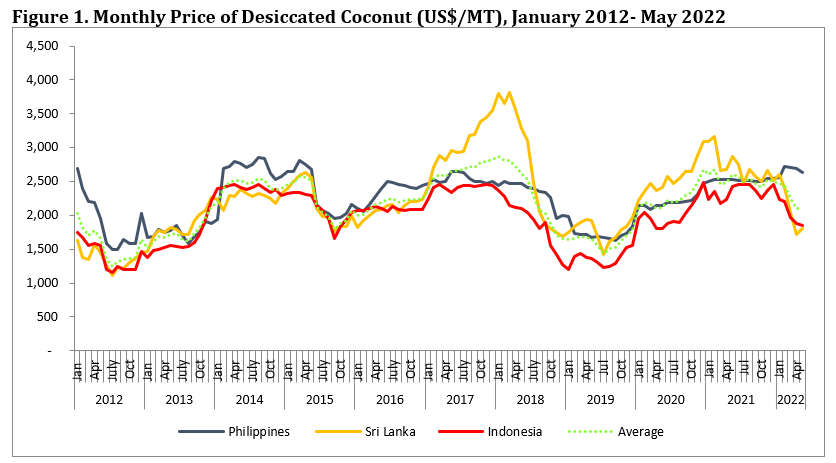
Price of desiccated coconut (DC) from Philippines benefited from higher demand especially in USA and Europe. The FOB price of DC from Philippines was US$2,557/MT in December 2021and leveled up to US$2631/MT in May 2022 or appreciated by 3% during the period. Meanwhile, better supply of DC in Philippines in the beginning of 2022 has put pressure on the price of DC in Indonesia. On average price of DC from Indonesia depreciated by more than 28% during January-May 2022. Indonesia’s FOB price of DC in December 2021 was US$2,450/MT and dropped to US$1,850/MT in May 2022. Similarly, Sri Lankan DC price declined from US$2,603/MT to US$1,806/MT in May 2022 mainly due to economic crisis in the country.
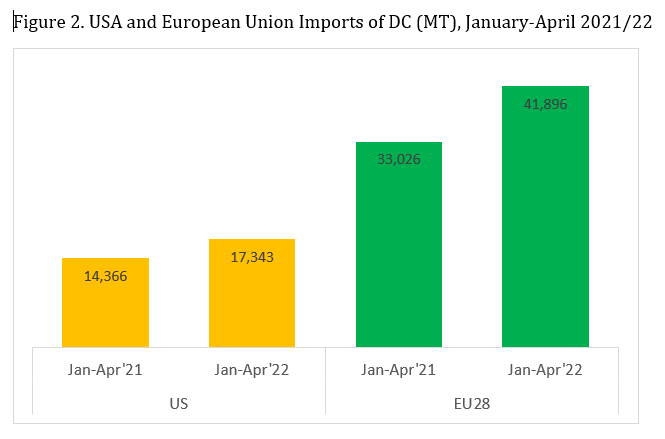
Global market of desiccated coconut (DC) showed a positive trend in the first quarter of 2022 following increasing trend in the previous year. Imports of the products by the main importing regions such as Europe and USA increased during the first quarter of 2022. US imports of desiccated coconut rose by 21% compared to the same period in 2021. Similarly, demand of desiccated coconut by European countries went up by 27% during the period. Shipments of DC to European countries amounted for 41,896 tons of during the period of January-April 2022.
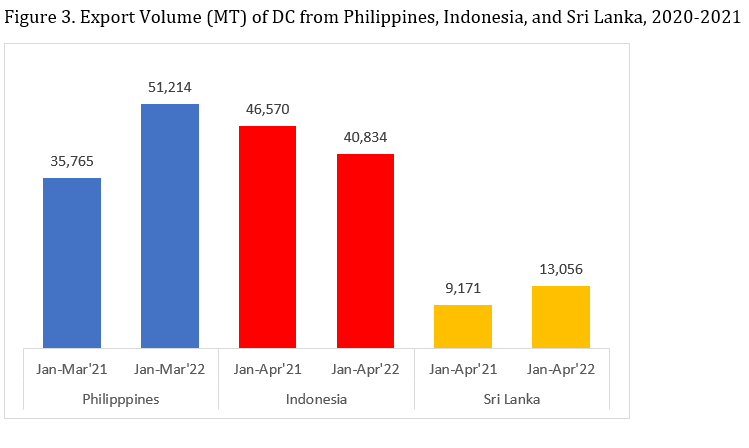
On the other side, supply of DC was also improving as most of DC factories is back to normal production capacity supported by higher coconut production. Export of DC from Philippines, the largest exporting country, increased from 35,765 tons in January-March 2021 to 51,214 tons January-March 2022. The increase was following a positive trend in the previous year. In 2021, export DC from Philippines was 160,117 tons which was 10% higher compared to 2020’s export volume. At the same time, Sri Lanka experienced higher export volume of DC. During January-April 2022, export DC from Sri Lanka reached 13,056 tons which was 42% higher as opposed to the volume a year earlier. However, export of DC from another main supplying country, Indonesia, showed a decrease during the first quarter of 2022. Indonesia suffered from higher supply of DC from Philippines.
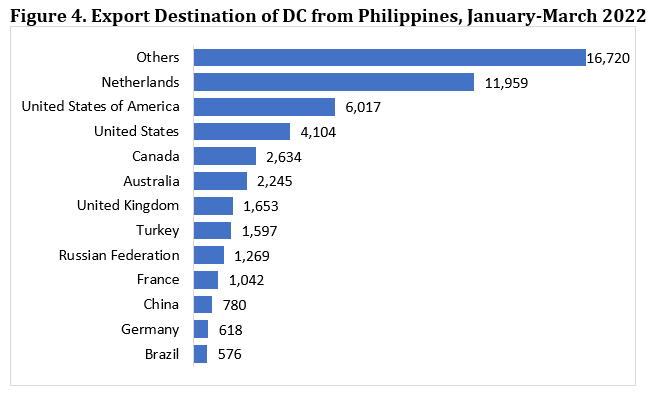
European countries and US are still the major destinations for desiccated coconut. During January-March 2022, Philippines shipped more than 28 thousand tons of DC to Europe and US market. The export volume was accounted for more than 55% of DC exports from the Philippines. Meanwhile, Middle East is the traditional market for DC from desiccated coconut from Sri Lanka.
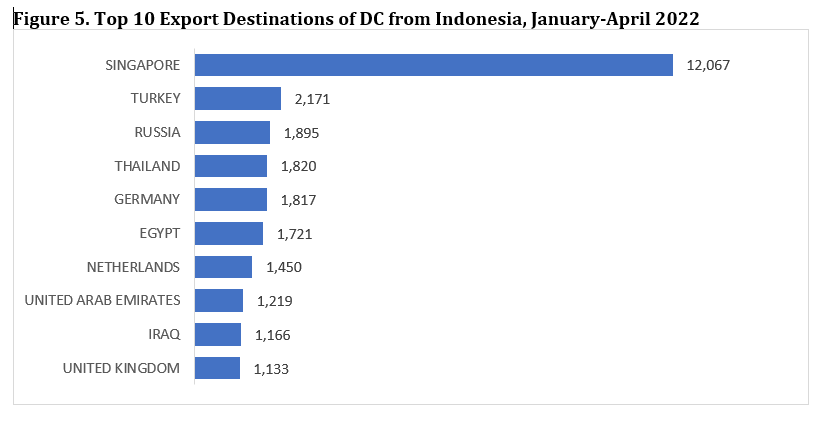
Meanwhile, Asia and Europe are the major destinations for DC from Indonesia. Singapore is the main hub for DC from Indonesia. During January-April 2022, 12,067 MT of DC was shipped to Singapore. It constituted for more than 30% of the total export volume of DC from Indonesia during the period. In Europe, Turkey, Russia, and Germany were the largest importing countries during the period. They received 2,171 tons, 1,895 tons, and 1,817 tons respectively.
Not available
A. GENERAL INFORMATION
1. Capital : Suva
2. Total Area (Sq. Km) : 18,720
3. Population* : 877,459
4. Gross Domestic Product (Million US$) : 5,270
5. Currency Unit : Fiji Dollar
6. Exchange rate to 1 US$ (Average) : 2.07
B. COCONUT INDUSTRY
1. Area Under Coconut (Ha) : 63,885
2. Total Coconut Production
2.1 In Million Nuts Equivalent : 159
2.2 In Copra Equivalent (MT) : 27,000
3. Estimated Domestic Consumption
3.1 In Million Nuts Equivalent : n.a.
3.2 In Copra Equivalent (MT) : n.a.
4. Exports Volume (MT)
4.1 Coconuts : 28
4.2 Coconut Oil : 1,955
4.3 Copra Meal : 28
4.4 Coconut Shell Charcoal : 4
4.5 Desiccated Coconut : 1
4.6 Other : 29
5. Coconut Export Value (‘000 US$) : 5,261
6. Total Export Revenue (Million US$) : 956
7. Percentage Contribution to National
Export Earnings (%) : 0.55
Guyana, a country on South America’s North Atlantic coast, is defined by its dense rainforest. English-speaking, with cricket and calypso music, it's culturally connected to the Caribbean region. Its capital, Georgetown, is known for British colonial architecture, including tall, painted-timber St. George’s Anglican Cathedral. A large clock marks the facade of Stabroek Market, a source of local produce.
Details to be advised --
Source : Google
A. GENERAL INFORMATION
1. Capital : New Delhi
2. Total Area (Sq. Km – Million) : 3.288
3. Population (Million) : 1,210
4. Gross Domestic Product (Rs. Core) : 104,728 (at Factor Cost-current price)
(2013-2014 estimate)
5. Currency Unit : Indian Rupee (INR)
6. Exchange rate to 1 US$ (Average 2014) : 61.03
B. COCONUT INDUSTRY
1. Area Under Coconut (Million Ha) : 2.14
2. Total Coconut Production
2.1 In Million Nuts Equivalent : 21,665
2.2 In Copra Equivalent (Million MT) : 3.10
3. Estimated Domestic Consumption
3.1 In Million Nuts Equivalent : 21,158
3.2 In Copra Equivalent (Million MT) : 3.02
4. Export Volume (MT) (2013-2014)
4.1 Coconuts : 52,720
4.2 Copra : 11,957
4.3 Coconut Oil : 7,067
4.4 Copra Meal : 37
4.5 Desiccated Coconut : 5,166
4.6 Coir Yarn : 4,187
4.7 Coir Mattings : 3,425
4.8 Coir Mats : 22,843
4.9 Rugs & Carpets : 93
4.10 Coir Rope : 498
4.11 Rubberized Coir : 965
4.12 Tufted Mat : 43,752
4.13 Coco Pith : 271,495
4.14 Coir Fibre : 173,902
4.15 Curled Coir : 11,263
4.16 Other Coir Products : 4,557
4.17 Coconut Shell Charcoal : 24,773
4.18 Coconut Shell Based Activated Carbon : 96,561
5. Coconut Export Value (Million Rs.) : 26,322
(Million US$) 431
6. Total Export Value (Million US$) : 3,079
7. Percentage Contribution to National Export Earnings (%) : 0.14
*Decrease in the export $ value compared to previous year (2012) is due to the increase in the Exchange rate
A. GENERAL INFORMATION
1. Capital : Jakarta
2. Total Area (Sq. Km) : 1,904,569
3. Population (Million) : 264.6
4. Gross Domestic Product (US$ Billion) : 1,015.42
5. Currency Unit : Rupiah (Rp)
6. Exchange rate to 1 US$ (Average) : 13,381
B. COCONUT INDUSTRY
1. Area Under Coconut (Million Ha) : 3.54
2. Total Coconut Production
2.1 In Million Nuts Equivalent : 14,356
2.2 In Copra Equivalent (Million MT) : 2.87
3. Estimated Domestic Consumption
3.1 In Nuts Equivalent (000 MT) : 8,376
3.2 In Copra Equivalent (000 MT) : 1,675
4. Number of Coconut Farmers (000 Household) (2017) : 6,517
5. Export Volume (MT)
4.1 Fresh Coconuts Mature Nuts : 903,862
4.2 Copra : 24,425
4.3 Coconut Oil : 510,441
4.4 Copra Meal : 202,090
4.5 Desiccated Coconut : 98,038
4.6 Coconut Milk/Cream/Powder : 27,696
4.7 Shell Charcoal : 311,270
4.8 Activated Carbon : 20,076
4.9 Fibre & Fibre Products : 31,136
6. Coconut Export Value (US$ Million) : 1,487
7. Total Export Revenue (US$ Million) : 168,775
8. Percentage Contribution to National Export Earnings (%) : 0.88
A. GENERAL INFORMATION
1. Capital : Kingston
2. Total Area (Sq. Km) : 10,991
3. Population (Million) : 2.721
4. Gross Domestic Product (US$ billion) : 13.89
5. Currency Unit : Jamaican Dollar
6. Exchange rate to 1 US$ : 111
B. COCONUT INDUSTRY
1. Area Under Coconut ('000 Ha) : 15.9
2. Total Coconut Production
2.1 In Million Nuts Equivalent : 98.5
2.2 In Copra Equivalent ('000 MT) : 16.4
3. Estimated Domestic Consumption
3.1 In Million Nuts Equivalent : 97,4
3.2 In Copra Equivalent (Million MT) : 0.016
4. Export Volume (MT)
4.1 Coconuts : 77
4.2 Coconut Oil : 4.3
4.3 Coconut Shell Charcoal : 0.8
4.4 Others -
5. Coconut Export Value ('000 US$) : 236.3
6. Total Export Revenue ('000 US$) : 1,455,000
7. Percentage Contribution to National Export Earnings (%) : 0.02
A. GENERAL INFORMATION
1. Capital : Nairobi
2. Total Area (Sq. Km) : 580,000
3. Population (Million) : 45.55
4. Gross Domestic Product (US$ Billion) : 60.94
5. Currency Unit : Shilling
6. Exchange rate to 1 US$ : 90.47
B. COCONUT INDUSTRY
1. Area Under Coconut (‘000 Ha) : 177
2. Total Coconut Production
2.1 In Million Nuts Equivalent : 259
2.2 In Copra Equivalent ('000 MT) : 19.9
3. Estimated Domestic Consumption
3.1 In Million Nuts Equivalent : 110
3.2 In Copra Equivalent (MT) : 1,404
4. Export Volume (MT)
4.1 Copra : N.A.
4.2 Coconut Oil : 27.23
4.3 Copra Cake : N.A.
5. Coconut Export Value (US$) : 1,270,255
6. Total Export Revenue (US$ ‘000) : 454,924
7. Percentage Contribution to National Export Earnings (%) : 0.28
A. GENERAL INFORMATION
1. Capital : Tarawa
2. Total Area (Sq. Km) : 726.34
3. Population : 112,334
4. Gross Domestic Product (US$ million) : 166.8
5. Currency Unit : Australian $
6. Exchange rate to 1 US$ (Average) : 1.11
B. COCONUT INDUSTRY
1. Area Under Coconut (Ha) : 19,852
2. Total Coconut Production
2.1 In Million Nuts Equivalent : 54.6
2.2 In Copra Equivalent (MT) : 9,134
3. Estimated Domestic Consumption
3.1 In Million Nuts Equivalent : N.A.
3.2 In Copra Equivalent (MT) : N.A.
4. Export Volume
4.1 Coconut Oil (MT) : 2,939
4.2 Copra (MT) : 1,332
4.3 Copra Meal (MT) : 216
5. Coconut Export Value (US$ ‘000) : 4,516
6. Total Export Revenue (US$ ‘000) : 9,764
7. Percentage Contribution to National Export Earnings (%) : 46.3
A. GENERAL INFORMATION
1. Capital : Kuala Lumpur
2. Total Area (Sq. Km) : 330,396
3. Population (Million) : 31.58
4. Gross Domestic Product (US$ Billion) : 354.29
5. Currency Unit : Ringgit Malaysia
6. Exchange rate to 1 US$ (Average) : 4.035
B. COCONUT INDUSTRY
1. Area Under Coconut (Ha) : 87,550
2. Total Coconut Production
2.1 In Million Nuts Equivalent : 653
2.2 In Copra Equivalent (MT) : 130,698
3. Estimated Domestic Consumption
3.1 In Million Nuts Equivalent : N.A.
3.2 In Copra Equivalent (MT) : N.A.
4. Export Volume (MT)
4.1 Fresh Coconuts : 48,247
4.2 Copra : 684
4.3 Coconut Oil : 187,665
4.4 Copra Meal : 2,206
4.5 Desiccated Coconut : 9,800
4.6 Coconut Milk Powder : 3,575
4.7 Activated Carbon : 15,197
4.8 Fibre & Fibre Products (Coir Fibre) : 11,877
4.9 Other Non – Traditional Products Export Like : N.A.
VCO, Coconut Water, etc.
5. Coconut Export Value (Million US$ ) : 2,037
6. Total Export Revenue (Million US$) : 2,681,452
7. Percentage Contribution to National Export Earnings (%) : 0.08
A. GENERAL INFORMATION
1. Capital : Majuro
2. Total Area (Sq. Km) : 181.3
3. Population : 58,898
4. Gross Domestic Product (US$ Million) : 204
5. Currency Unit : US$
6. Exchange rate to 1 US$ (Average) : 1
B. COCONUT INDUSTRY
1. Area Under Coconut (Ha) : 7,624
2. Total Coconut Production
2.1 In Million Nuts Equivalent : 35
2.2 In Copra Equivalent (MT) : 5,000
3. Estimated Domestic Consumption
3.1 In Million Nuts Equivalent : N.A.
3.2 In Copra Equivalent (MT) : N.A.
4. Export Volume (MT)
4.1 Copra : -
4.2 Coconut Oil : 124
4.3 Coconut Cake : 482
5. Coconut Export (US$ ‘000 ) : 369
6. Total Export Value (US$ ‘000) : 861,720
7. Percentage Contribution to National Export Earnings (%) : 0.04
A. GENERAL INFORMATION
1. Capital : Palikir
2. Total Area (Sq. Km) : 702
3. Population : 102,116
4. Gross Domestic Product (US$ Million, 2013) : 318.071
5. Currency Unit : US Dollar
6. Exchange rate to 1 US$ (Average) : 1
B. COCONUT INDUSTRY
1. Area Under Coconut (Ha) : 18,252
2. Total Coconut Production
2.1 In Million Nuts Equivalent : 59
2.2 In Copra Equivalent (MT) : 7,373
3. Estimated Domestic Consumption
3.1 In Nuts Equivalent : N.A.
3.2 In Copra Equivalent : N.A.
4. Export Volume (MT)
4.1 Copra : 76
4.2 Coconut Oil : -
4.3 Other Non – Traditional Coconut Products export : N.A.
Like VCO, Coconut Water, etc.
5. Coconut Export Value (US$) : 26,556
6. Total Export Revenue (US$) : 34,675
7. Percentage Contribution to National Export Earnings (%) : N.A.
A. GENERAL INFORMATION
1. Capital : Honiara
2. Total Area(Sq. km) : 452,860
3. Population (million) : 8.606
4. Gross Domestic Product (US$ billion) : 23.077
5. Currency Unit : Bokolo Dollars
6. Exchange rate to 1 US$ : 3.279
B. COCONUT INDUSTRY
1. Area Under Coconut (1000 Ha) : 38
2. Total Coconut Production
2.1 In Million Nuts Equivalent : 100
2.2 In Copra Equivalent (MT) : 20,126
3. Estimated Domestic Consumption
3.1 In Million Nuts Equivalent : N.A.
3.2 In Copra Equivalent (Million MT) : N.A.
4. Exports Volume
4.1 Copra (MT) : 15,856
4.2 Coconut Oil (MT) : N.A.
5. Coconut Export Value (US$ '000) : 9,774
6. Total Export Revenue (US$ '000) : 439,871
7. Percentage Contribution to National
Export Earnings (%) : 2.22
A. GENERAL INFORMATION
1. Capital : Manila
2. Total Area (s.q. km) : 300,000
3. Population (Million) : 106.651
4. Gross Domestic Product (USD billion) : 330.481
5. Currency Unit : Peso
6. Exchange rate to 1 US$ (Average, 2013) : 52.661
B. COCONUT SECTOR
1. Area Under Coconut (Million Ha) : 3.50
2. Total Coconut Production
2.1 In Million Nuts Equivalent : 14,696
2.2 In Copra Equivalent (Million MT) : 2.217
3. Estimated Domestic Consumption
3.1 In Million Nuts Equivalent : 5,084
3.2 In Copra Equivalent (Million MT) : 0.77
4. Exports Volume (MT)
4.1 Fresh Coconuts : 2,474
4.2 Copra : 554
4.3 Coconut Oil : 907,606
4.4 Copra Meal : 551,198
4.5 Desiccated Coconut : 109,099
4.6 Coco Coir (Baled Coir, Twine, Pads) : 24,619
4.7 Coconut Acid Oil : 6,772
4.8 Coco Fiber Waste (Coco Peat/Dust) : 3,215
4.9 Shell Charcoal : 72,097
4.10 Activated Carbon : 61,304
4.11 Coconut Milk (Liquid) : 1,390
4.12 Coconut Milk (Powder) : 863
4.13 Makapuno : 54
4.14 Coconut Water (Liter) : 24,905,917
4.15 Others (Glycerin, Alkanolamide, Grated : 75,231
Coconut Meat, Nata de Coco, Frozen Coco Meat, Coco Chips, Bukayo, Coco Jam, Coco Flour, Coco Vinegar, Coco Husk Cubes, Toilet/Bath Soap, Soap Chips, Laundry Soap, Shampoo, Virgin Coconut Oil, Coco Shell Powder, Hydrogenated CNO)
5. Coconut Export Value (US$ Million) : 1,828
6. Total Export Revenue (US$ Million) : 50,913
7. Percentage Contribution to National : 3.59
Export Earnings (%)
A. GENERAL INFORMATION
1. Capital : Apia
2. Total Area (Sq. Km) : 2,830
3. Population : 196,000
4. Gross Domestic Product (US$ Million) : 884
5. Currency Unit : Tala
6. Exchange rate to 1 US$ (average) : 2.58
B. COCONUT INDUSTRY
1. Area Under Coconut (Ha) : 99,082
2. Total Coconut Production
2.1 In Million Nuts Equivalent : 267
2.2 In Copra Equivalent (MT) : 52,920
3. Estimated Domestic Consumption
3.1 In Million Nuts Equivalent : 250
3.2 In Copra Equivalent (MT) : 50.1
4. Export Volume (MT)
4.1 Fresh Coconut : 1,311
4.2 Copra (MT) : N.A.
4.2 Coconut Oil (MT) : 82
4.3 Copra Meal (MT) : 2,094
4.4 Coconut Cream (MT) : 100
4.5 Desiccated Coconut (MT) : 13
4.6 Drinking Nuts (Nos) : N.A.
4.7 Other Non - Traditional Coconut Products : N.A.
export like VCO. Coconut Water, etc.
5. Coconut Export Value (US$ '000) : 1,500
6. Total Export Revenue (US$ '000) : 32,196
7. Percentage Contribution to National Export Earnings (%) : 4.7
A. GENERAL INFORMATION
1. Capital : Honiara
2. Total Area(Sq. km) : 28,450
3. Population : 653,097
4. Gross Domestic Product (US$ Billion) : 1.294
5. Currency Unit : Bokolo Dollars
6. Exchange rate to 1 US$ : 7,953
B. COCONUT INDUSTRY
1. Area Under Coconut (Ha) : 38
2. Total Coconut Production
2.1 In Million Nuts Equivalent : 100
2.2 In Copra Equivalent (MT) : 20,126
3. Estimated Domestic Consumption
3.1 In Million Nuts Equivalent : N.A.
3.2 In Copra Equivalent (Million MT) : N.A.
4. Exports Volume
4.1 Copra (MT) : 15,856
4.2 Coconut Oil (MT) : N.A.
5. Coconut Export Value (US$ '000) : 9,774
6. Total Export Revenue (US$ '000) : 439,871
7. Percentage Contribution to National
Export Earnings (%) : 2.22
A. GENERAL INFORMATION
1. Capital : Colombo
2. Total Area (Sq. km) : 65,610
3. Population (Million) : 21.279
4. Gross Domestic Product (US$ Billion) : 88.484
5. Currency Unit : Sri Lankan Rupee (LKR)
6. Exchange rate to 1 US$ (Average) : 162.56
B. COCONUT INDUSTRY
1. Area Under Coconut ('000 Ha) : 440
2. Total Coconut Production
2.1 In Million Nuts Equivalent : 2,870
2.2 In Copra Equivalent (Million MT) : 0.549
3. Estimated Domestic Consumption
3.1 In Million Nuts Equivalent : 2,104
3.2 In Copra Equivalent (Million MT) : 0.402
4. Exports Volume (MT)
4.1 Coconuts ('000 Nuts) : 33,073
4.2 Copra : 4,776
4.3 Coconut Oil : 11,254
4.4 Copra Meal : 2,556
4.5 Desiccated Coconut : 51,132
4.6 Coconut Cream/Milk : 17,413
4.7 Coconut Milk Powder : 5,835
4.8 Shell Charcoal : 8,736
4.9 Activated Carbon : 37,230
4.10 Mattress Fibre : 36,320
4.11 Bristle Fibre : 16,409
4.12 Twisted Fibre : 74,744
4.13 Coir Yarn : 2,205
4.14 Coir Twine : 8,222
4.15 Coir Fibre Dust/Pith : 157,177
4.16 Husk Chip : 14,610
4.17 Coconut Shell Flour : 486
5. Coconut Export Value (US$ Million) : 558.21
6. Total Export Revenue (US$ Million) : 11,130
7. Percentage Contribution to National Export Earnings (%) : 5.015
A. GENERAL INFORMATION
1. Capital : Bangkok
2. Total Area (Ha) : 320,696,800
3. Population (Million) : 69.428
4. Gross Domestic Product (US$ Billion) : 504.4
5. Currency Unit : Baht
6. Exchange rate to 1 US$ (Average) : THB 32.3
B. COCONUT INDUSTRY
1. Area Under Coconut ('000 Ha) : 206
2. Total Coconut Production
2.1 In Million Nuts Equivalent : 1,001
2.2 In Copra Equivalent ('000 MT) : 219
3. Estimated Domestic Consumption
3.1 In Million Nuts Equivalent : 1,001
3.2 In Copra Equivalent ('000 MT) : 219
4. Export Volume (MT)
4.1 Coconut : 531
4.2 Copra : 339
4.3 Coconut Oil : 1,960
4.4 Copra Meal : 2.3
4.5 Desiccated Coconut : 3,780
4.6 Coconut Milk : 179,297
4.7 Activated Carbon : 8,829
4.8 Fibre & Fibre Products : 39,704
4.9 Coconut Shell : 2,752
5. Coconut Export Value (US$ Million) : 408
6. Total Export Value (US$ Million) : 188,421
7. Percentage Contribution to Export Earnings (%) : 0.22
A. GENERAL INFORMATION
1. Capital : Nukualofa
2. Total Area (Sq. Km) : 748
3. Population : 103,000
4. Gross Domestic Product (Million) : US$439
5. Currency Unit : TOP$
6. Exchange rate to 1 US$ (average) : 2.237
B. COCONUT INDUSTRY
1. Area Under Coconut (000 Ha) : 31.1
2. Total Coconut Production
2.1 In Nuts Equivalent (Milllion) : 75.1
2.2 In Copra Equivalent ('000 MT) : 15.7
3. Estimated Domestic Consumption
3.1 In Million Nuts Equivalent : 27.6
3.2 In Copra Equivalent (MT) : 5,520
4. Export Volume (MT)
4.1 Coconut : 1,592
4.2 Copra : -
4.3 Coconut Oil : -
4.4 Drinking Nuts : 152
4.5 Other Non - Traditional Coconut Products
export like VCO. Coconut Water, etc. : -
5. Coconut Export Value ('000 US$) : 634
6. Total Export Revenue ('000 US$) : 15,259
7. Percentage Contribution to National
Export Earnings (%) : 4.15
A. GENERAL INFORMATION
1. Capital : Port Vila
2. Total Area (Sq. Km) : 12,189
3. Population : 298,333 (est 2020)
4. Gross Domestic Product (US$ Million) : 870 (est 2017)
5. Currency Unit : Vatu (Vt)
6. Exchange rate to 1 US$ (average) : 97.07
B. COCONUT SECTOR
1. Area Under Coconut ('000 Ha) : 91.9
2. Total Coconut Production
2.1 In Million Nuts Equivalent : 415
2.2 In Copra Equivalent ('000 MT) : 79.2
3. Estimated Domestic Consumption
3.1 In Million Nuts Equivalent : N.A.
3.2 In Copra Equivalent (MT) : N.A.
4. Exports Volume (MT)
4.1 Copra : 25,194
4.2 Copra Meal : 4,786
4.3 Coconut Oil : 9,208
4.4 Desiccated Coconut : 0.1
5. Coconut Export Value (’000 USD) : 2,683
6. Total Export Revenue (’000 USD) : 6,100
7. Percentage Contribution to National Export Earnings (%) : 43.98
A. GENERAL INFORMATION
1. Capital : Hanoi
2. Total Area (Sq. Km) : 331,212
3. Population (Million) : 95.546
4. Gross Domestic Product (US$ Billion) : 244.498
5. Currency Unit : Vietnam Dong (VND)
6. Exchange rate to 1 US$ : 22,602
B. COCONUT SECTOR
1. Area Under Coconut (Ha) : 157,853
2. Total Coconut Production
2.1 In Million Nuts Equivalent : 1,246
2.2 In Copra Equivalent (MT) : 373,675
3. Estimated Domestic Consumption
3.1 In Million Nuts Equivalent : N.A.
3.2 In Copra Equivalent (MT) : N.A.
4. Exports Volume (MT)
4.1 Coconut : 69,548
4.2 Copra : 12,787
4.3 Coconut Oil : 991
4.4 Copra Meal : -
4.5 Desiccated Coconut : 40,302
4.6 Coir Yarn : -
4.7 Coir Mattings, Coir Mats : -
4.8 Rugs & Carpets : 446
4.9 Coir Rope : -
4.10 Coconut Shell Charcoal : 28,856
4.11 Activated Carbon : 14,513
5. Coconut Export Value (US$ Million) : 225
6. Total Export Revenue (US$ Million) : 150,475
7. Persentage Contribution To National Export Earnings (%) : 0.14